Hi All,
I’ve taken a slight detour this weekend from my work on the 3D cablenet course and have been playing around with some data-viz in Blender.
It’s been on my mind for a while to try and use Blender to visualise our simulation data - so, I decided to give this some time over the weekend and after a lot of coffee, I’m starting to get somewhere. In the 3D spaceframe course, we visualise the deflection by generating a simple wireframe.
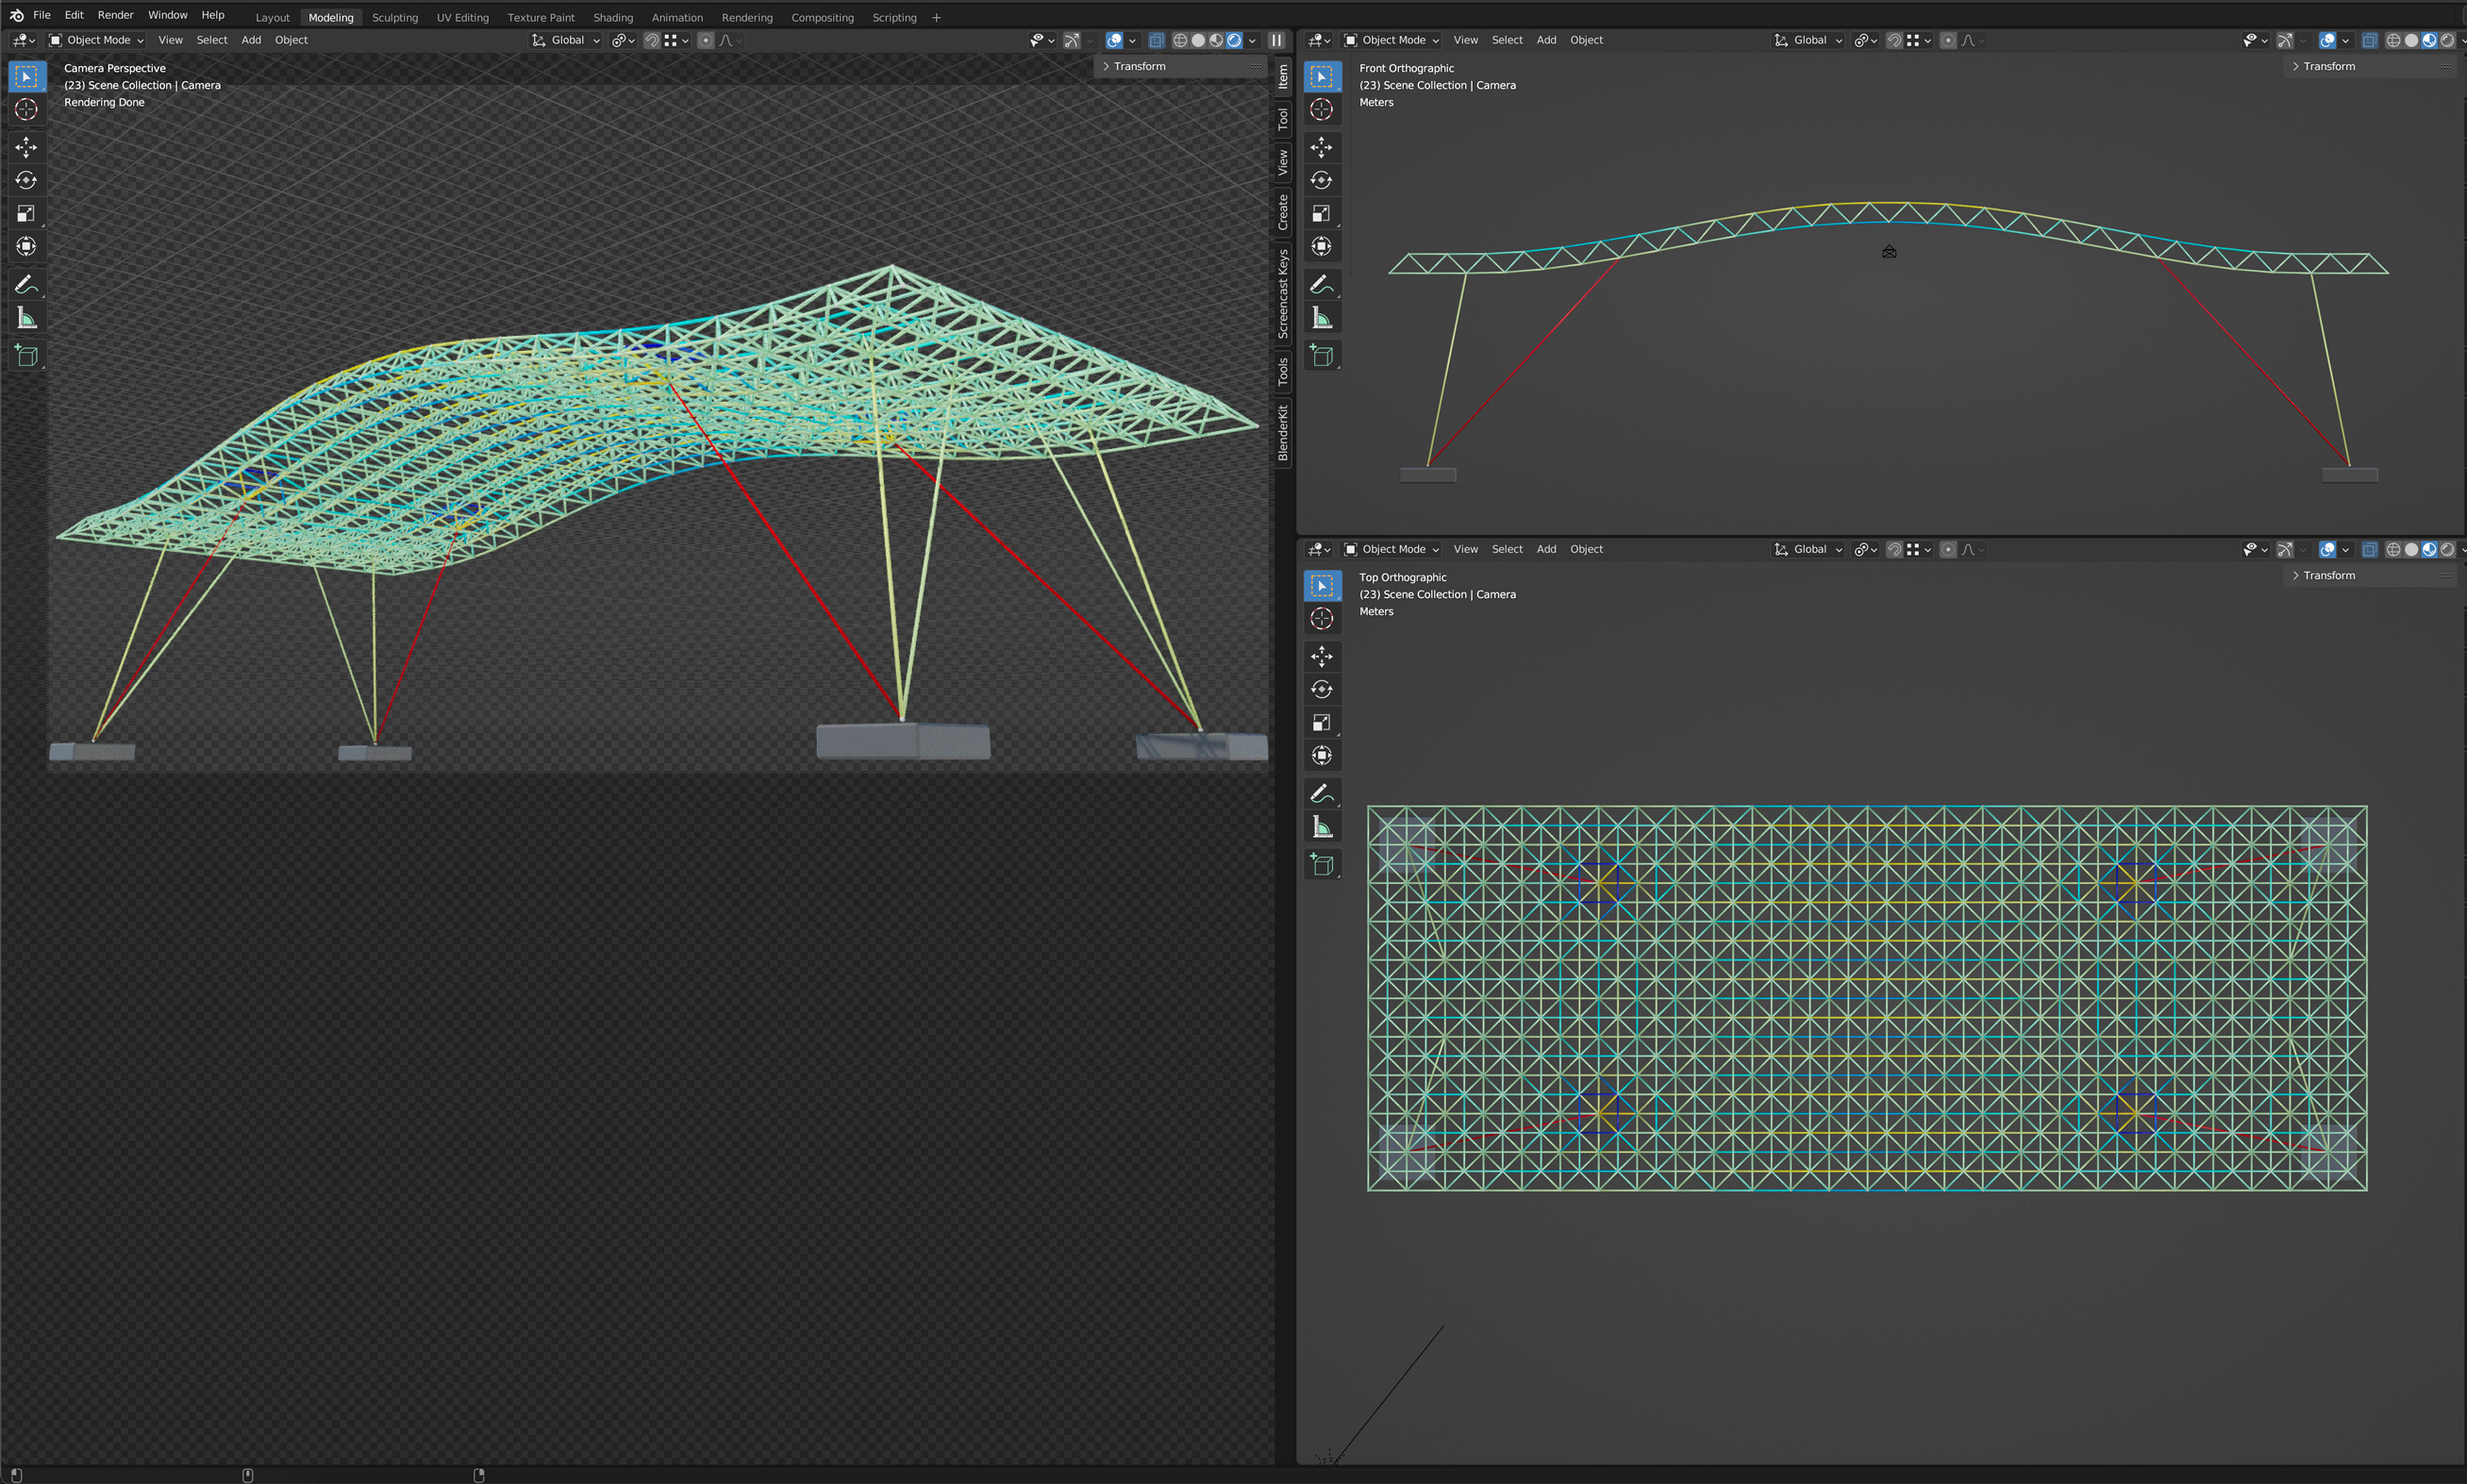
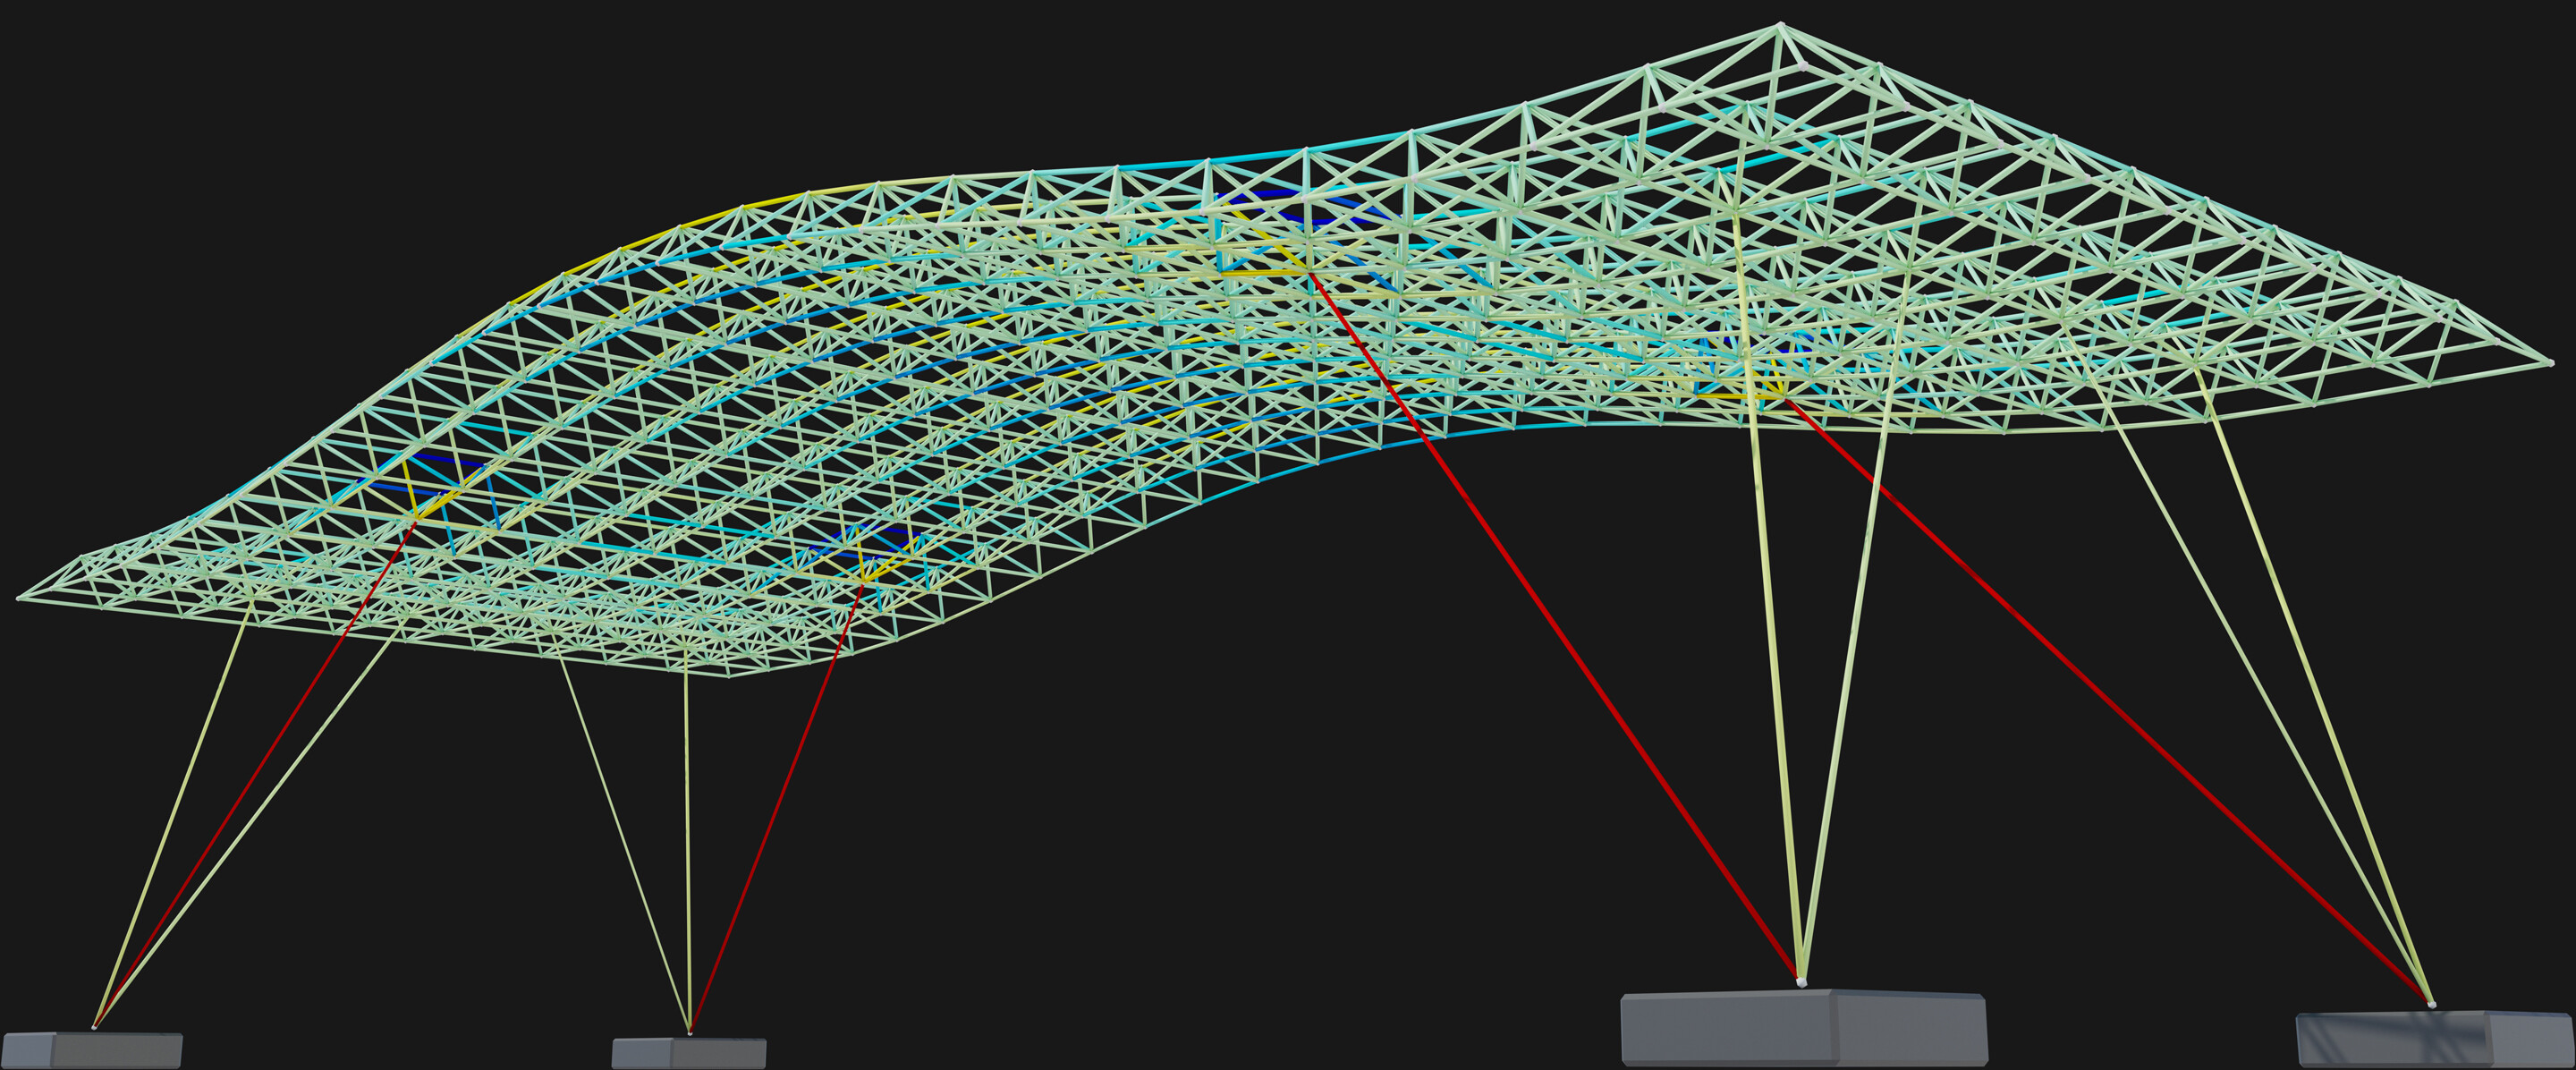
I wanted a way of visualising the axial forces too. So, I wrote a script that takes the data from the end of the analysis Notebook and rebuilds the structure in Blender. Each member is assigned a custom material with the colour determined by the magnitude of axial force. See below…
The nice thing about using Blender is that you can easily navigate around the model in 3D space and by including the force magnitude in the name of each material, you can easily determine the force magnitude in any member. You can also generate nice, high-res images of your structure/data (particularly helpful for project presentations).
I’ll record a video tutorial showing how to write the script. Once you’ve understood how to do this for axial forces, it’s pretty easy to extend other structure/data visualisations.
Enjoy the rest of your weekend!
Seán


