Questions and discussion for this lecture live here. Fire away by hitting Reply below ![]()
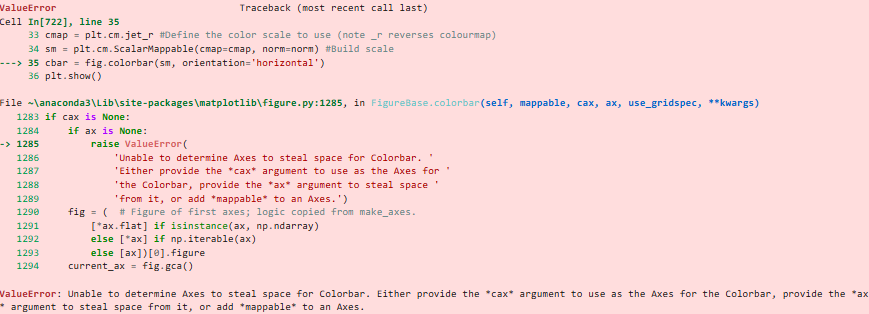
Excuse me Dr.Sean. I’ve got this problem just after ‘cbar’ definition run (cbar = fig.colorbar(sm, orientation=‘horizontal’)). How could I solve it?
Hey,
The issue is that we now need to explicitly state the axes that the colourbar should be attached to. So, on line 42, when we define the colorbar, we need to pass ax=axes, so the full command is:
cbar = fig.colorbar(sm, ax=axes, ticks=ticks, orientation='horizontal', aspect=50)
This will resolve the error.
Seán