Questions and discussion for this lecture live here. Fire away by hitting Reply below ![]()
Hi Sean,
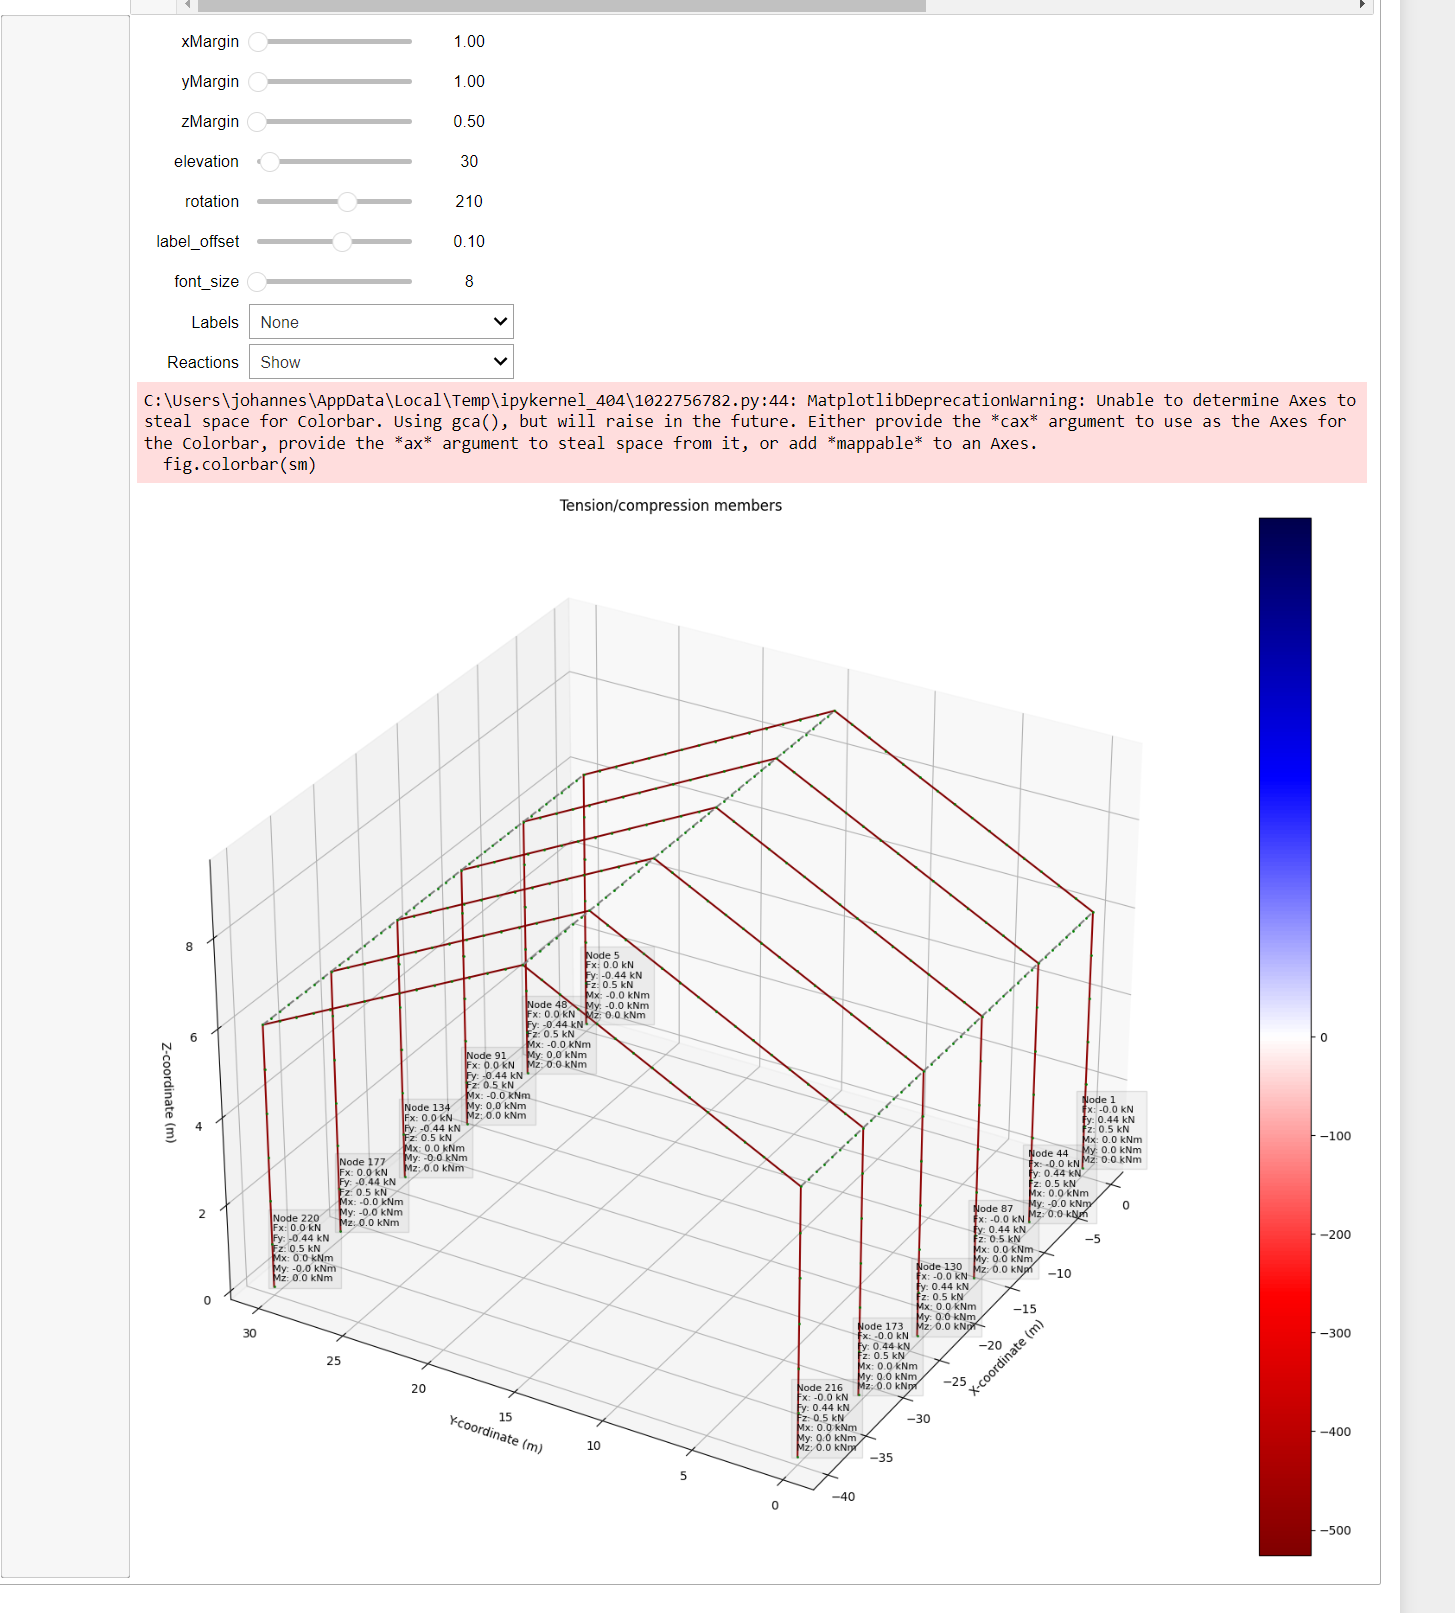
I am running python 3.10 with the latest matplotlib. In cell 28 Force Heatmap Plot the DivergingNorm is now deprecated and needs to be replaced by TwoSlopeNorm, this however needs some different definition of where the colorbar goes, i haven’t looked into it yet but just fyi, this is how it looks after putting the new norm in there:
Hi Johannes,
Yes, I’m aware of this alright. You can simply swap the function names, replace DivergingNorm with TwoSlopeNorm. The function arguments and all other code should stay the same.
Seán
Hi Sean,
the output I attached is what I see after swapping the function names, (so using TwoSlopeNorm) - there seems to be another issue.
This works:
cax = fig.add_axes([2.8, 0.3, 0.1, 2.8])
fig.colorbar(sm, cax=cax)
1 Like