Questions and discussion for this lecture live here. Fire away by hitting Reply below ![]()
Hi Sean, I don’t get why it is legit to represent the two components as two rotating vectors in the complex plane. I mean, they do not have a real part and an imaginary part, but just the former.
I surely must be missing something
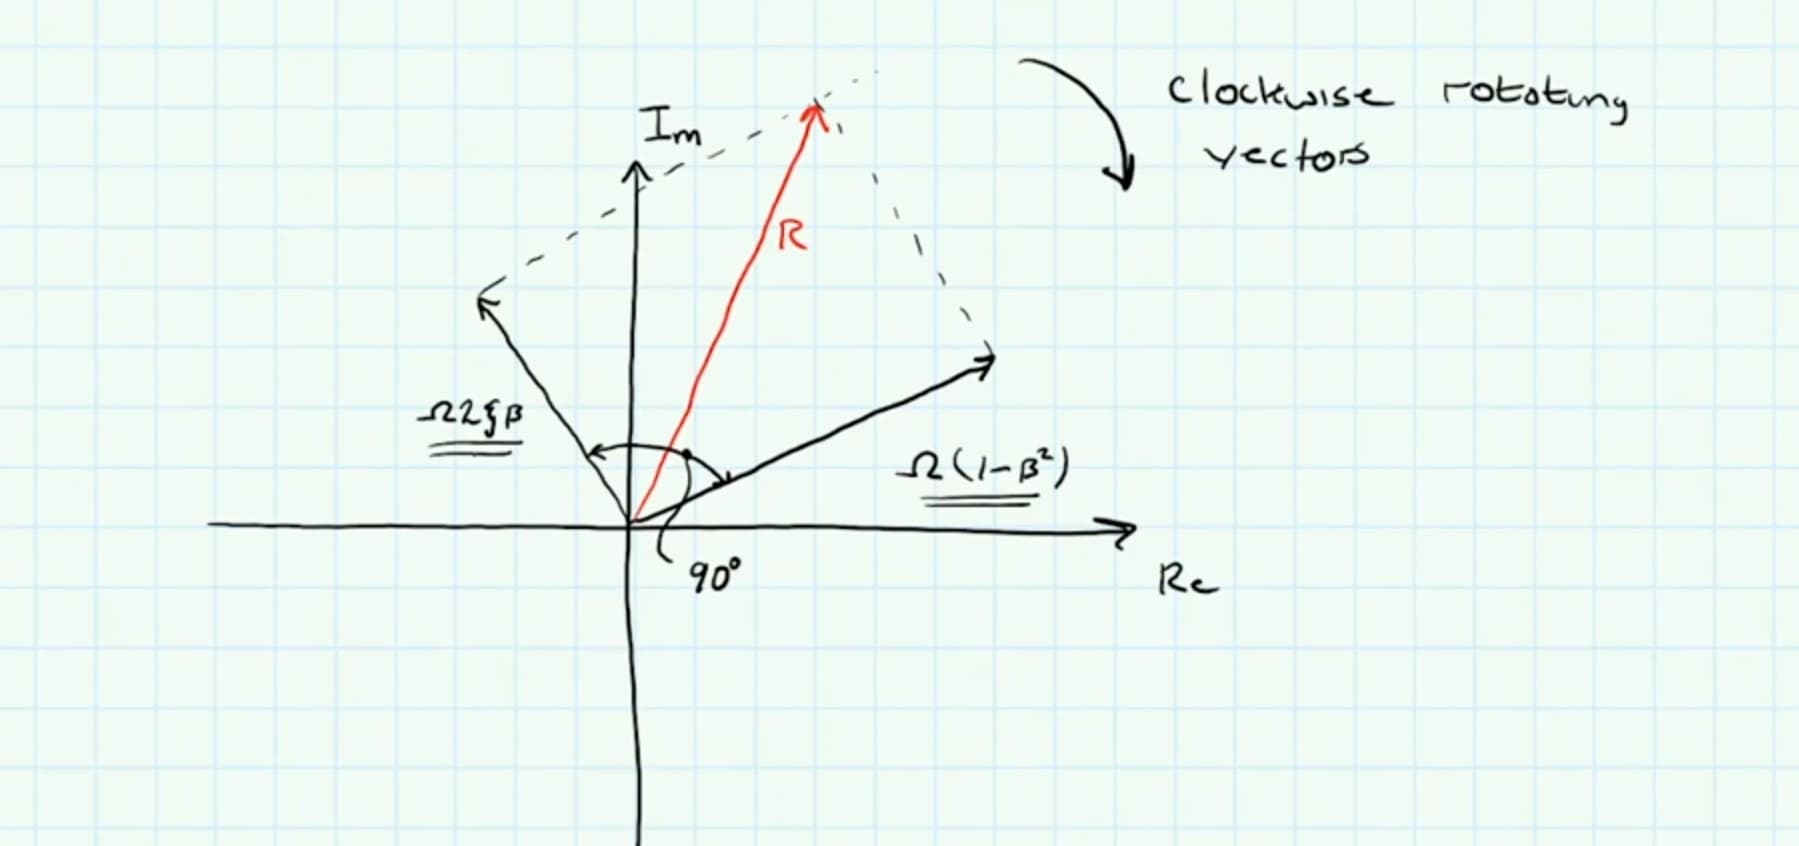
@Oliviero, although we’re not generally very used to seeing it represented this way, the rotating vector on the complex plane is just another way to represent a sinusoidal oscillation.
You can see the link between the ‘phasor’ representation and the time-domain (wave) representation when you project the tip of the rotating response arrow onto the real axis - it will trace out a sinusoidal oscillation.
The benefit of the phasor (rotating arrow) representation is that it makes it easier to ‘break out’ and visualise the phase relationship between different components of the response and how the total response lags the applied force due to damping in the system. It’s actually a really nice way to visualise the response.
Don’t think about the response as having ‘an imaginary’ component, as such - the complex plane (with its one imaginary axis) is just the mathematical construct we use to frame our rotating vector representation.
Hello Sean,
We are expressing the steady state response of the system with the red legend right ? Considering the R value is the only the amplitude of the steady state response, it shall define the maximum and minumum values in the graph for the red legend. Howe ver, we are seeing the sinusoidal graph, that means we are actually drawing the steady state response of the structure, right ?
It is just a terminological question, just to clear the blur. Time : 11:27 for the video.
Thanks a lot again for your fantastic teaching skills and explanation.
Cheers
Burak
Hey Burak,
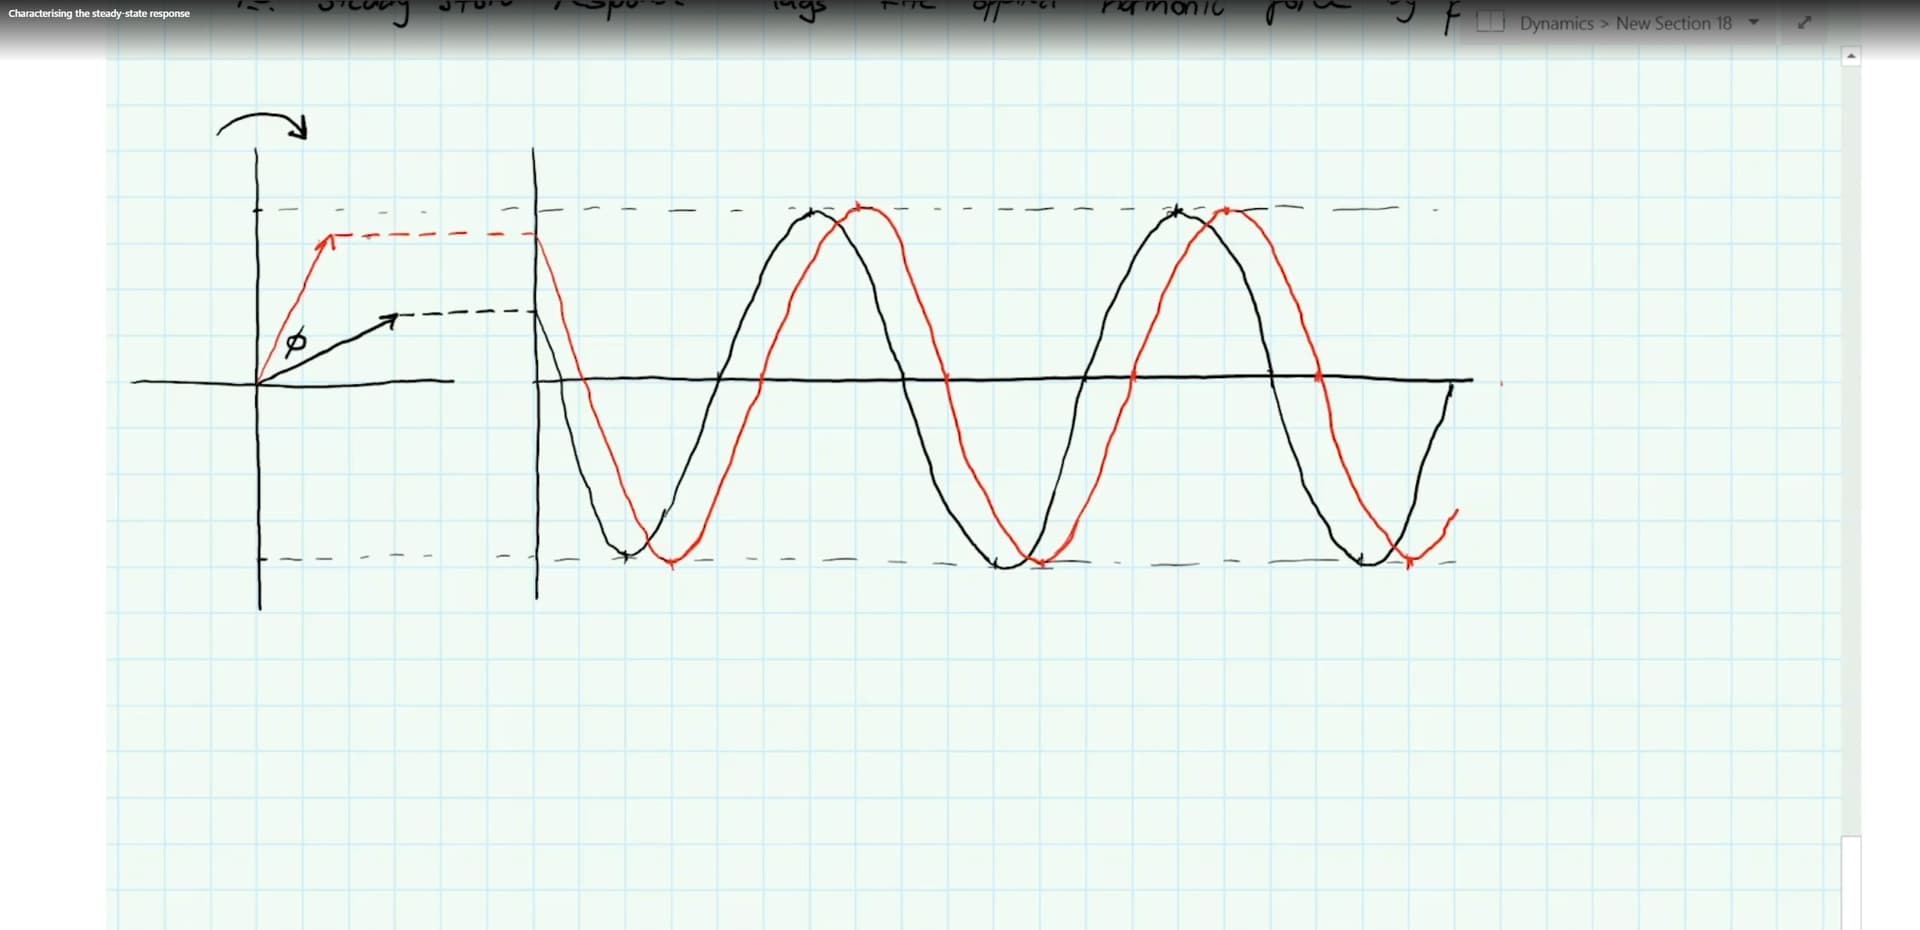
Thanks for the question - gives me a good opportunity to clarify. The red rotating vector represents the steady-state response of the system. The length of this vector defines the amplitude of the response, seen in the time-domain when the vector is at the 12 and 6 o-clock positions. The black rotating vector that leads the red vector represents only the component of the response that is in phase with the harmonic force.
Now, I have drawn both vectors the same length. This is careless - in truth, with any non-zero level of damping, this vector will be shorter than the red vector, since a lag (between force and response) is introduced by any damping.
So, it would have been clearer in the video if I drew the black oscillation with a smaller amplitude than the red oscillation.
I hope that helps clear up any confusion - please follow up if not.
Seán
Hey Sean,
In that case, please correct me if i am wrong about my interpretation about these ;
1- Actually, Black line on the previous graph in previous reply is representing the (omega*(1-beta^2)) with the oscillation. Obviously, the length of this vector (which is abs ((omega*(1-beta^2)))) is the amplitude of this component which is totally in phase with the force which is P(t) =P_0 * sin(omegat) and smaller than the amplitude of the steady state response of the structure (abs(R)).
2- this black line on the previous graph in previous reply is not the external force P(t) =P_0 * sin(omegat) itself. That line represents the structure’s response with the amplitude of abs ((omega*(1-beta^2)))) and actually the oscillation behaviour of this line can be characterized exactly as ; (omega*(1-beta^2))sin(omegat).
3- Also, for the steady state response components of the structure and the external force can we interpret the following ? "the omega constant which is multiplied with both the component 1 and component 2 of the structural system is obviously smaller value than the external force amplitude which is P_0 (P_0sin(omegat)). Therefore, if we would draw the external force with oscillation behaviour on the previous graph in reply, we would see the same shape like the component of the structure response which is in phase with the force, but with definitely with a higher amplitude.
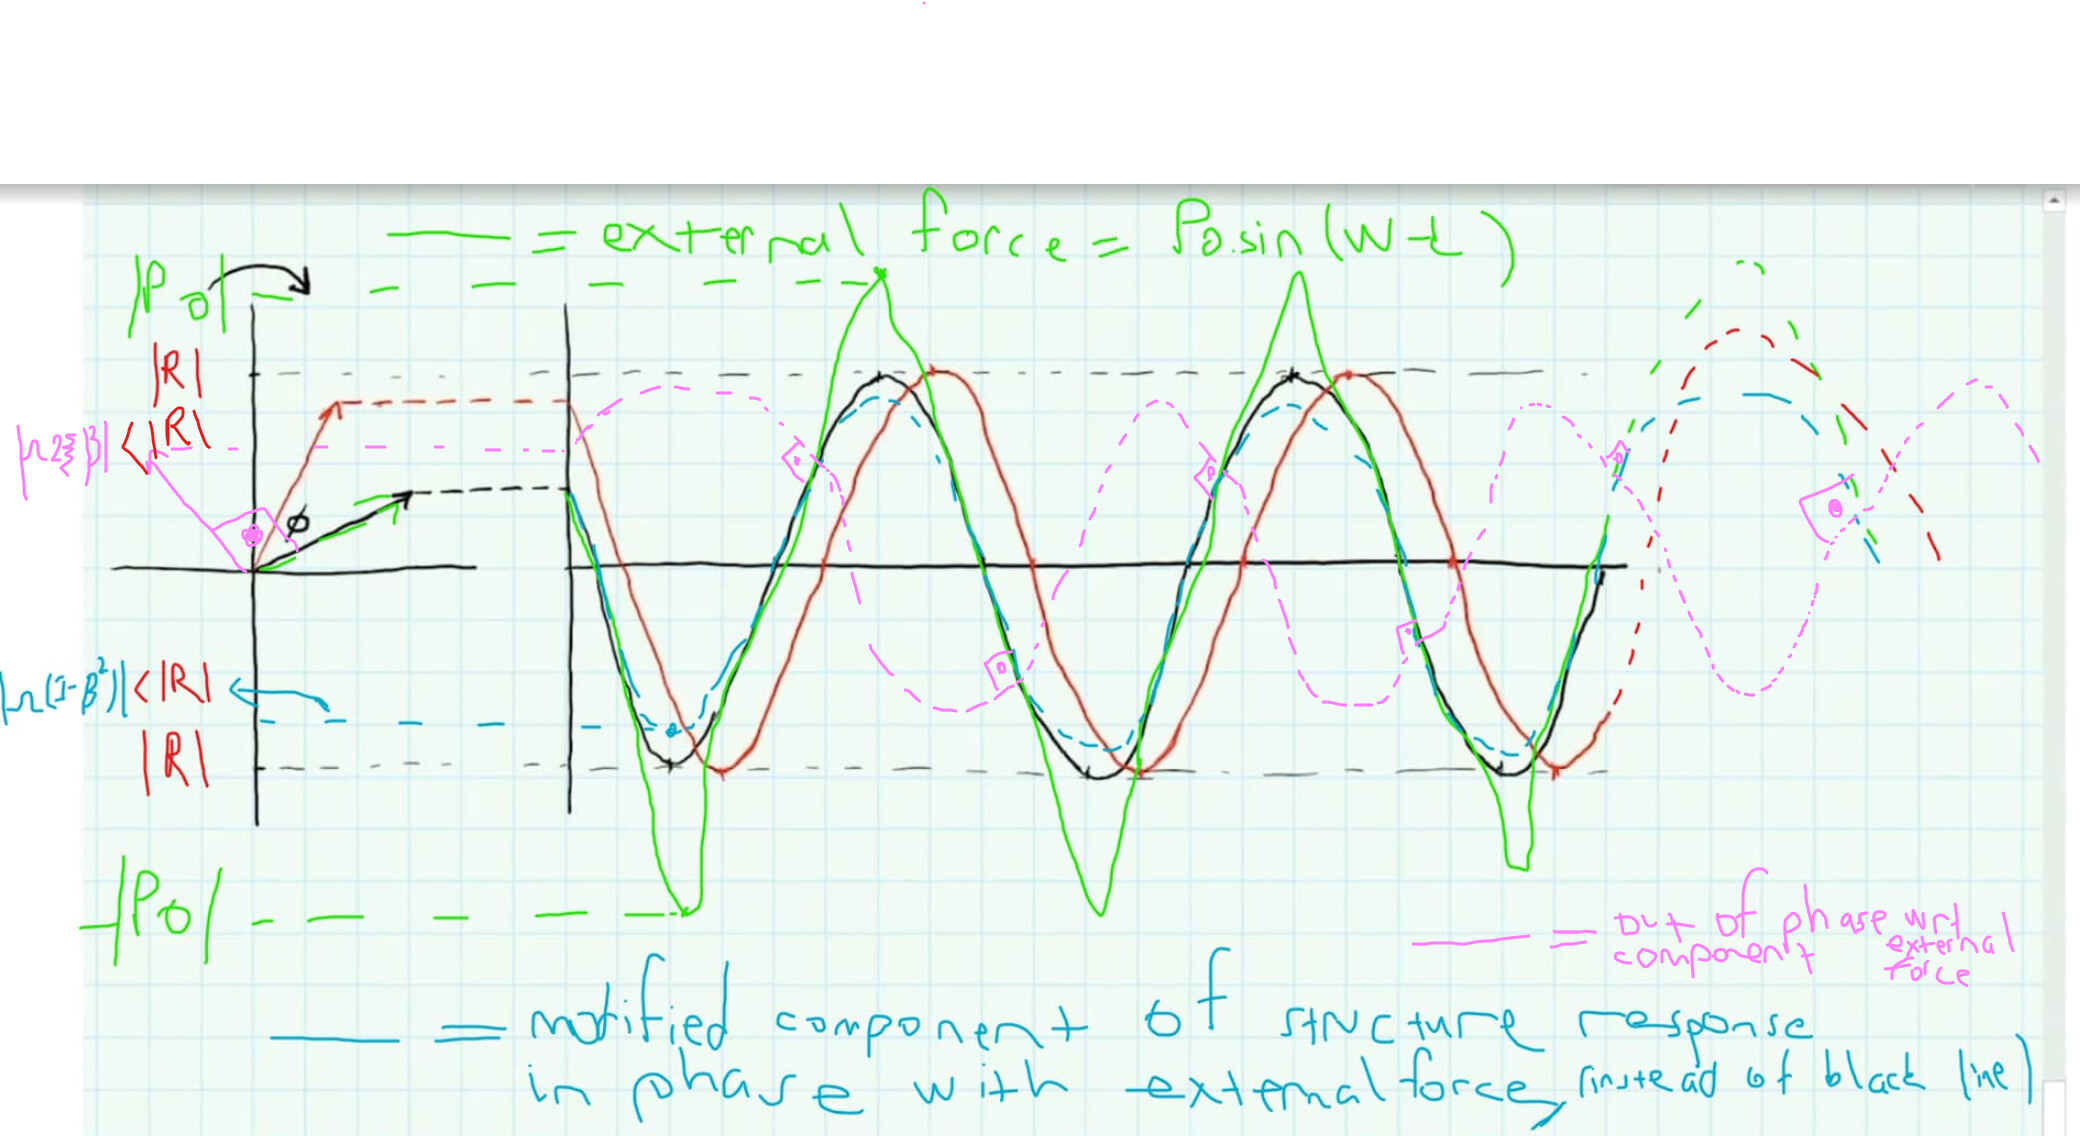
I tried to explain what i understood from above graph with my paint edit. (Draw with no damping case.)
I hope that i managed to make my questions clear ![]()
It would be extremely nice to see all of these 4 in a graph i believe, if you can help us about that.
Are these correct interpretations ?
Hi Burak,
I’ve provided inline responses for clarity…
1- Actually, Black line on the previous graph in previous reply is representing the (omega*(1-beta^2)) with the oscillation. Obviously, the length of this vector (which is abs ((omega*(1-beta^2)))) is the amplitude of this component which is totally in phase with the force which is P(t) =P_0 * sin(omegat) and smaller than the amplitude of the steady state response of the structure (abs(R)).
Correct.
2- this black line on the previous graph in previous reply is not the external force P(t) =P_0 * sin(omega t) itself. That line represents the structure’s response with the amplitude of abs ((omega*(1-beta^2)))) and actually the oscillation behaviour of this line can be characterized exactly as ; (omega*(1-beta^2))sin(omega t).
Almost correct - this line is not the force, but the component of the response in phase with the applied force. It is not the complete response - just one component of it.
3- Also, for the steady state response components of the structure and the external force can we interpret the following ? "the omega constant which is multiplied with both the component 1 and component 2 of the structural system is obviously smaller value than the external force amplitude which is P_0 (P_0sin(omega t)). Therefore, if we would draw the external force with oscillation behaviour on the previous graph in reply, we would see the same shape like the component of the structure response which is in phase with the force, but with definitely with a higher amplitude.
Yes, the frequency and phase of the oscillation that represents the harmonic force would match the frequency and phase of the component of the response in phase with the force, as mentioned in 2 above. The complete response oscillation would match the frequency of the applied force but it would lag behind it (out of phase) due to damping. Beware of representing force and displacement on the same time-history, since they don’t share the same dimensions (need different y-axes).
I hope that helps - I would say your understanding thus far is sound. ![]()
Seán
1 Like