Questions and discussion for this lecture live here. Fire away by hitting Reply below ![]()
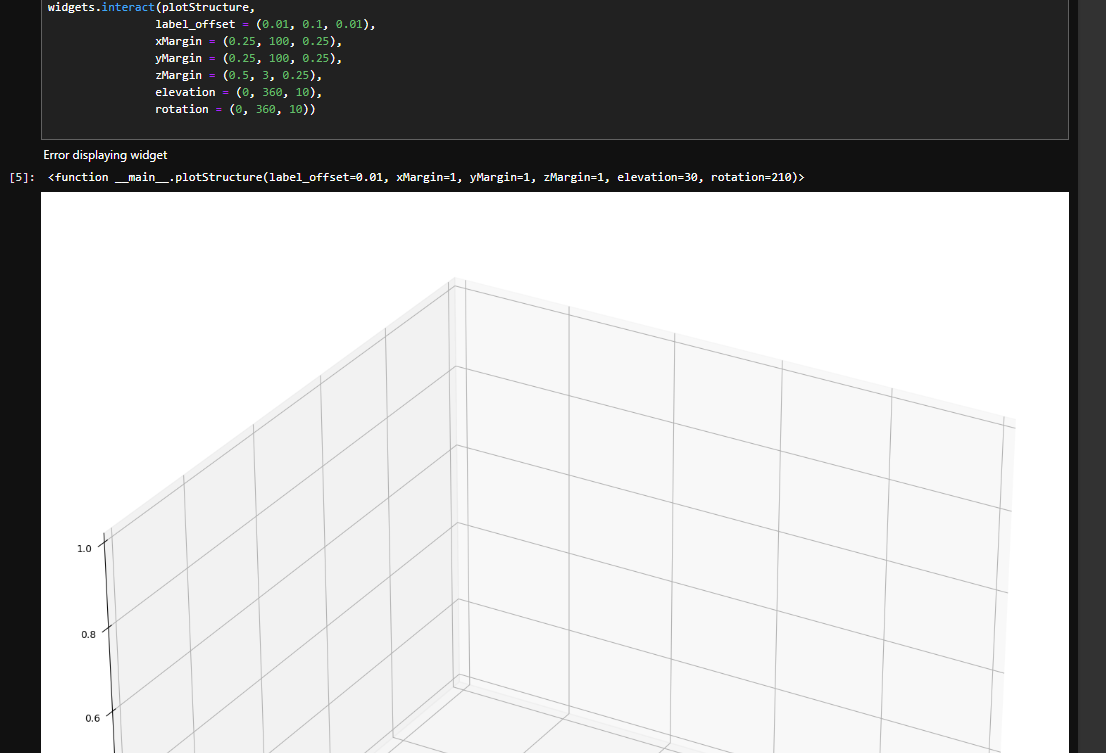
I don’t even know how to begin debugging this output…
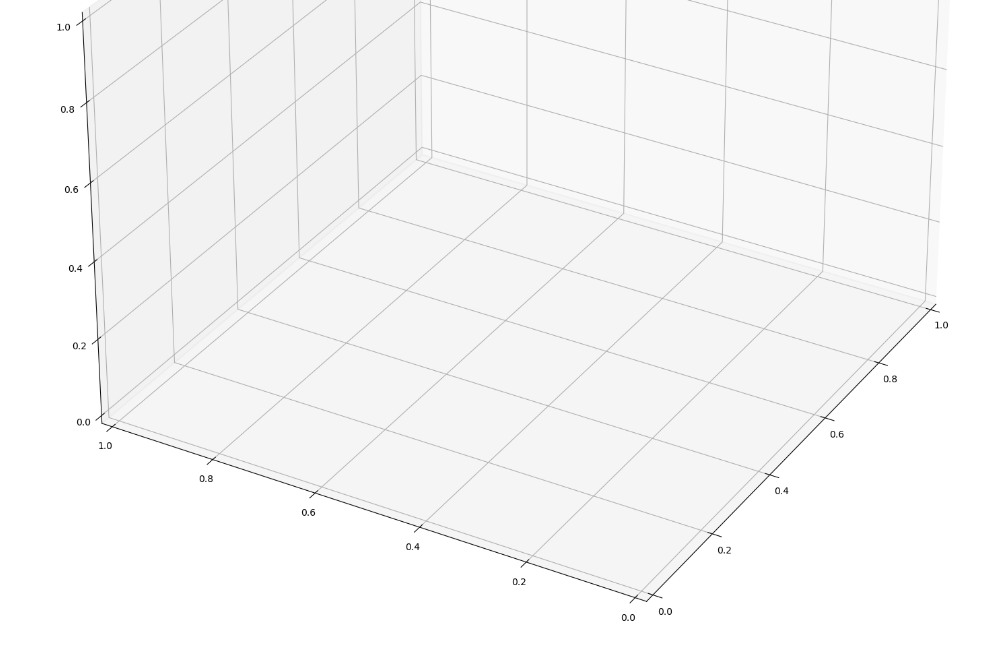
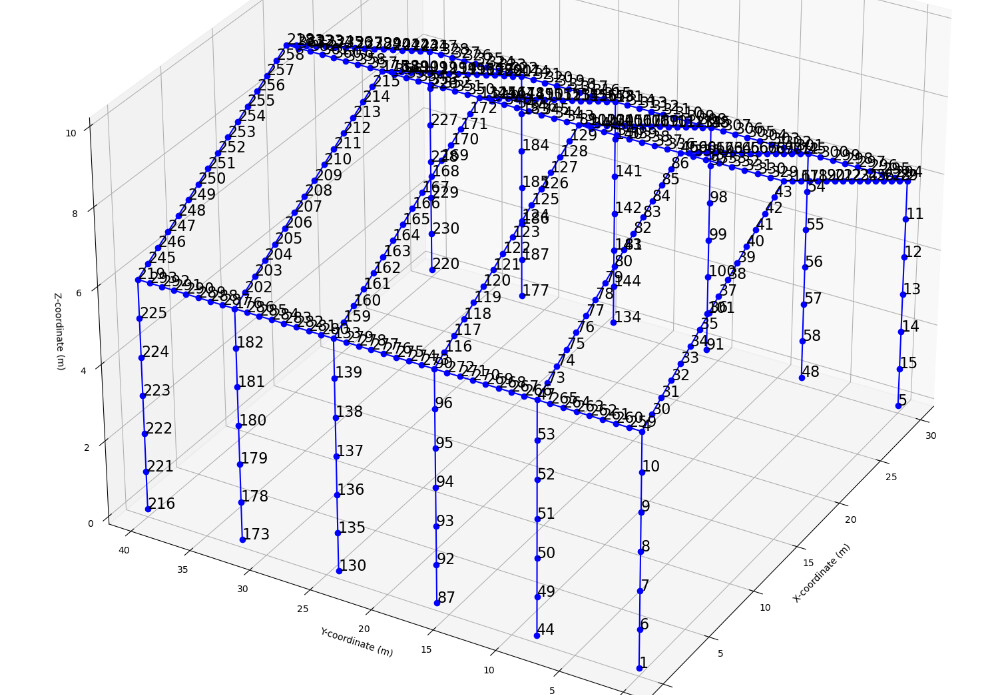
Where do I start? the axis labels are missing, and the nodes are missing…
Hey Juliana,
Sorry about the delay!
Firstly, don’t get discouraged!
Are you hitting this error while following the course lesson (using the data provided) or does this occur when you try to work with your own model data?
S
I’m using course data only.
Ok, can you run the code using the version of the data that you downloaded from the course? The objective is to identify exactly where your code deviates from the example code (which you can download also).
The first thing to rule out is any issue with the model data - to do this, we need to start with the data downloaded from the course. If this runs ok, then we know the issue is with the data you originally tried to run (presumably data that you generated while following the course). If this doesn’t run, then we know the issue is with the code you’ve written while following the course.
Which outcome do you get?
This is the outcome I get using the data downloaded from the course. The exact error message is preserved. It mentions a file name in the above print out I am unaware of. I don’t think the widgets are working on my computer.
Please let me know if there are any specifics I must install on my PC preferably itemized as I am unable to perform installs myself as this runs through a third party admin. I started the course with just blender, then was delayed waiting for authorization for anaconda distribution just to get jupyter notebooks.
If there is any other package I am supposed to have installed I need to know.
Hey Juliana,
I’ve just sent you an email. We’ll take the conversation offline for now and if the resolution is generally applicable, I’ll post it here for others after we iron out the issue.
Cheers,
S
OK, mystery solved - an easy fix in the end!
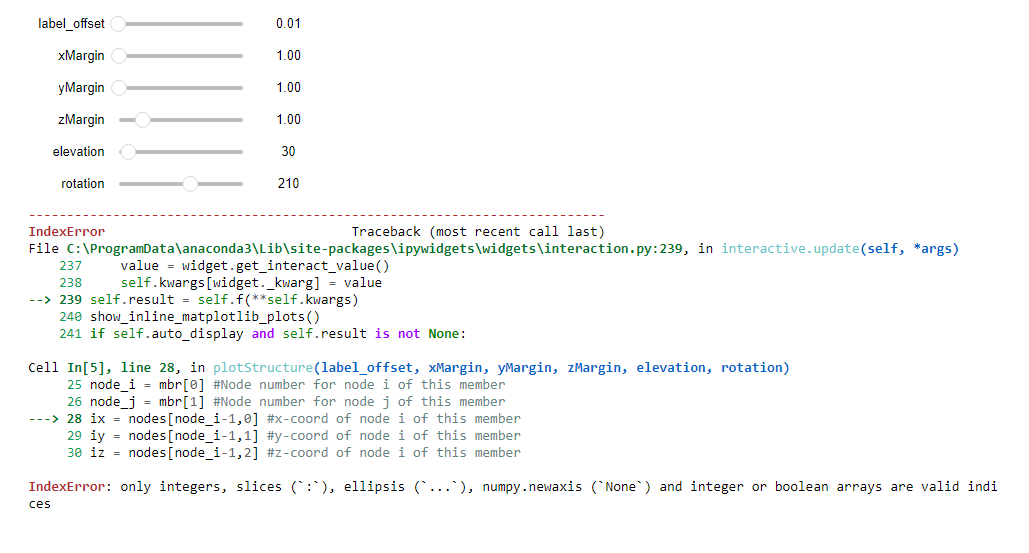
The issue is that on line 28 (as seen in the error screenshot), to assign ix we’re indexing into nodes. The error message is complaining, saying we can only index into an array using integers etc. This suggests the index (node_i in this case) is not an integer. Sure enough if you print it out you see that it’s a float (decimal number). I’m not completely sure why, in your case, node_i and node_j were cast as floats rather than ints. Regardless, the fix is easy enough, you just need to force them to be ints by casting them as such on line 25 and 26, so instead of:
node_i = mbr[0] #Node number for node i of this member
node_j = mbr[1] #Node number for node j of this member
do…
node_i = int(mbr[0]) #Node number for node i of this member
node_j = int(mbr[1]) #Node number for node j of this member
…and the code will execute as expected.
Seán
Thank you so much! I just couldn’t see it. I have spotted code typos during your actual lectures as was proud of myself for catching them until now (missing opening brackets nothing major) but I was stumped here and just couldn’t move forward. Thanks again!
1 Like
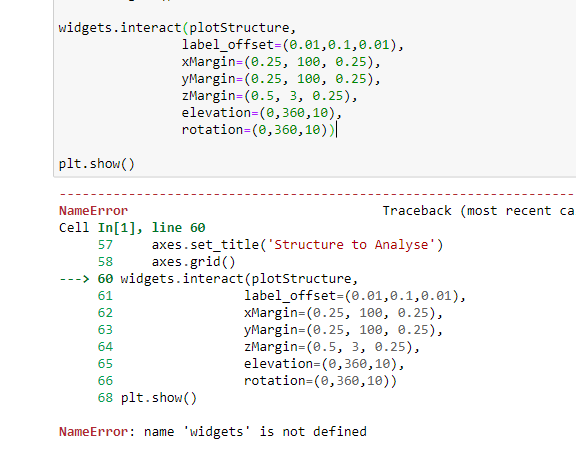
First time I got the chance to go back over my files. Ran the code again and got stuck here:
Hi Juliana,
Because the error message says that widgets was never defined, this suggests that the import statement may be missing at the very top of the file. Did you include it and then execute the cell?
S
OMG, I didn’t realize it only runs one cell at a time. I re-run the notebook from the top and it works! Thank you so much for familiarizing me. I was going through the lessons again to find the mistake I made, didn’t think it was familiarizing with the notebook itself!
Thanks again
It’s likely that you have orientated your model differently in Blender or that you simply have different orientation parameters set.
#To obtain a plot with dimensions proportional to structure dimensions, use this code
#Set axis limits
maxX = nodes.max(0)[0] #Retreive the maximum value for x-axis
maxY = nodes.max(0)[1] #Retreive the maximum value for y-axis
maxZ = nodes.max(0)[2] #Retreive the maximum value for z-axis
minX = nodes.min(0)[0] #Retreive the minimum value for x-axis
minY = nodes.min(0)[1] #Retreive the minimum value for y-axis
minZ = nodes.min(0)[2] #Retreive the minimum value for z-axis
axes.set_xlim(minX-xMargin, maxX+xMargin)
axes.set_ylim(minY-yMargin, maxY+yMargin)
axes.set_zlim(minZ, maxZ+zMargin) #No margin for minZ as we want the structure resting at bottom of plot
#YMD_Set axis limits to get a structure with true dimensions
maxDim = max((maxX-minX), (maxY-minY), (maxZ-minZ)) #Find maximum axis dimension
axes.set_xlim(minX-xMargin, minX+maxDim+xMargin) #Use maximum axis dimension to get realistic shape
axes.set_ylim(minY-yMargin, minY+maxDim+yMargin) #Use maximum axis dimension to get realistic shape
axes.set_zlim(minZ, minZ+maxDim+zMargin) #No margin for minZ as we want the structure resting at bottom of plot
Hi Sean,
Do you know if we need the widgets to work to plot the structure? My Jupiter notebook does not support widgets, and it looks like I have version 1.5, and the error says I need 2.0.0 as it is registered. I have made sure my .csv files are outputting nodal data, but my structure does not plot in the 3D box like you show. I have mostly checked my blender and Jupyter code, but I will be checking it as I wait for your response. I am following your videos and writing the code step by step as you do.
Thanks.
No, you do not need to use widgets in your plotting. These simply allow you to add sliders that allow you to modify plot parameters and have the plot automatically regenerate. Widgets are only a small quality of life improvement - you can absolutely live without them!
You can strip these out and simply execute the code inside the of the plot function…i.e. take it out of the plot function and execute it in a normal cell…obviously you will need to replace any parameters that were previously passed into the function (since now you’re executing the code inside the function).
S
1 Like
Hey Sean, I just noticed that when you go back into Blender in this Lecture 19, your Blender code 1 is different now than in Lecture 14 when we wrote it initially. Do we need to update our code like you did?
Thanks.
No - don’t worry about that…a slight continuity error due to me re-recording a lecture after updating it later on in the course. You can stick with the original code and it will work fine (basically ignore the code change if I haven’t made a point of explaining it).
Seán